Inhaltsverzeichnis
Automated Process Optimization
Automated Process Optimization
With Automated Process Optimization, suitable process parameters (e.g. throughput, screw speed, barrel temperature profile) can be determined automaticallyand evaluated against defined target criteria. The optimization is performed using Particle Swarm Optimization (PSO / swarm intelligence).
Opening the optimization dialog
To open the optimization wizard, select from the main menu:
Command path: Main menu > Simulation > Optimization…
An optimization wizard with multiple steps will start and guide you through the setup and execution of the optimization task.
Choose meta machines
In this step you define which machine configurations (meta machines) shall be considered for the optimization.
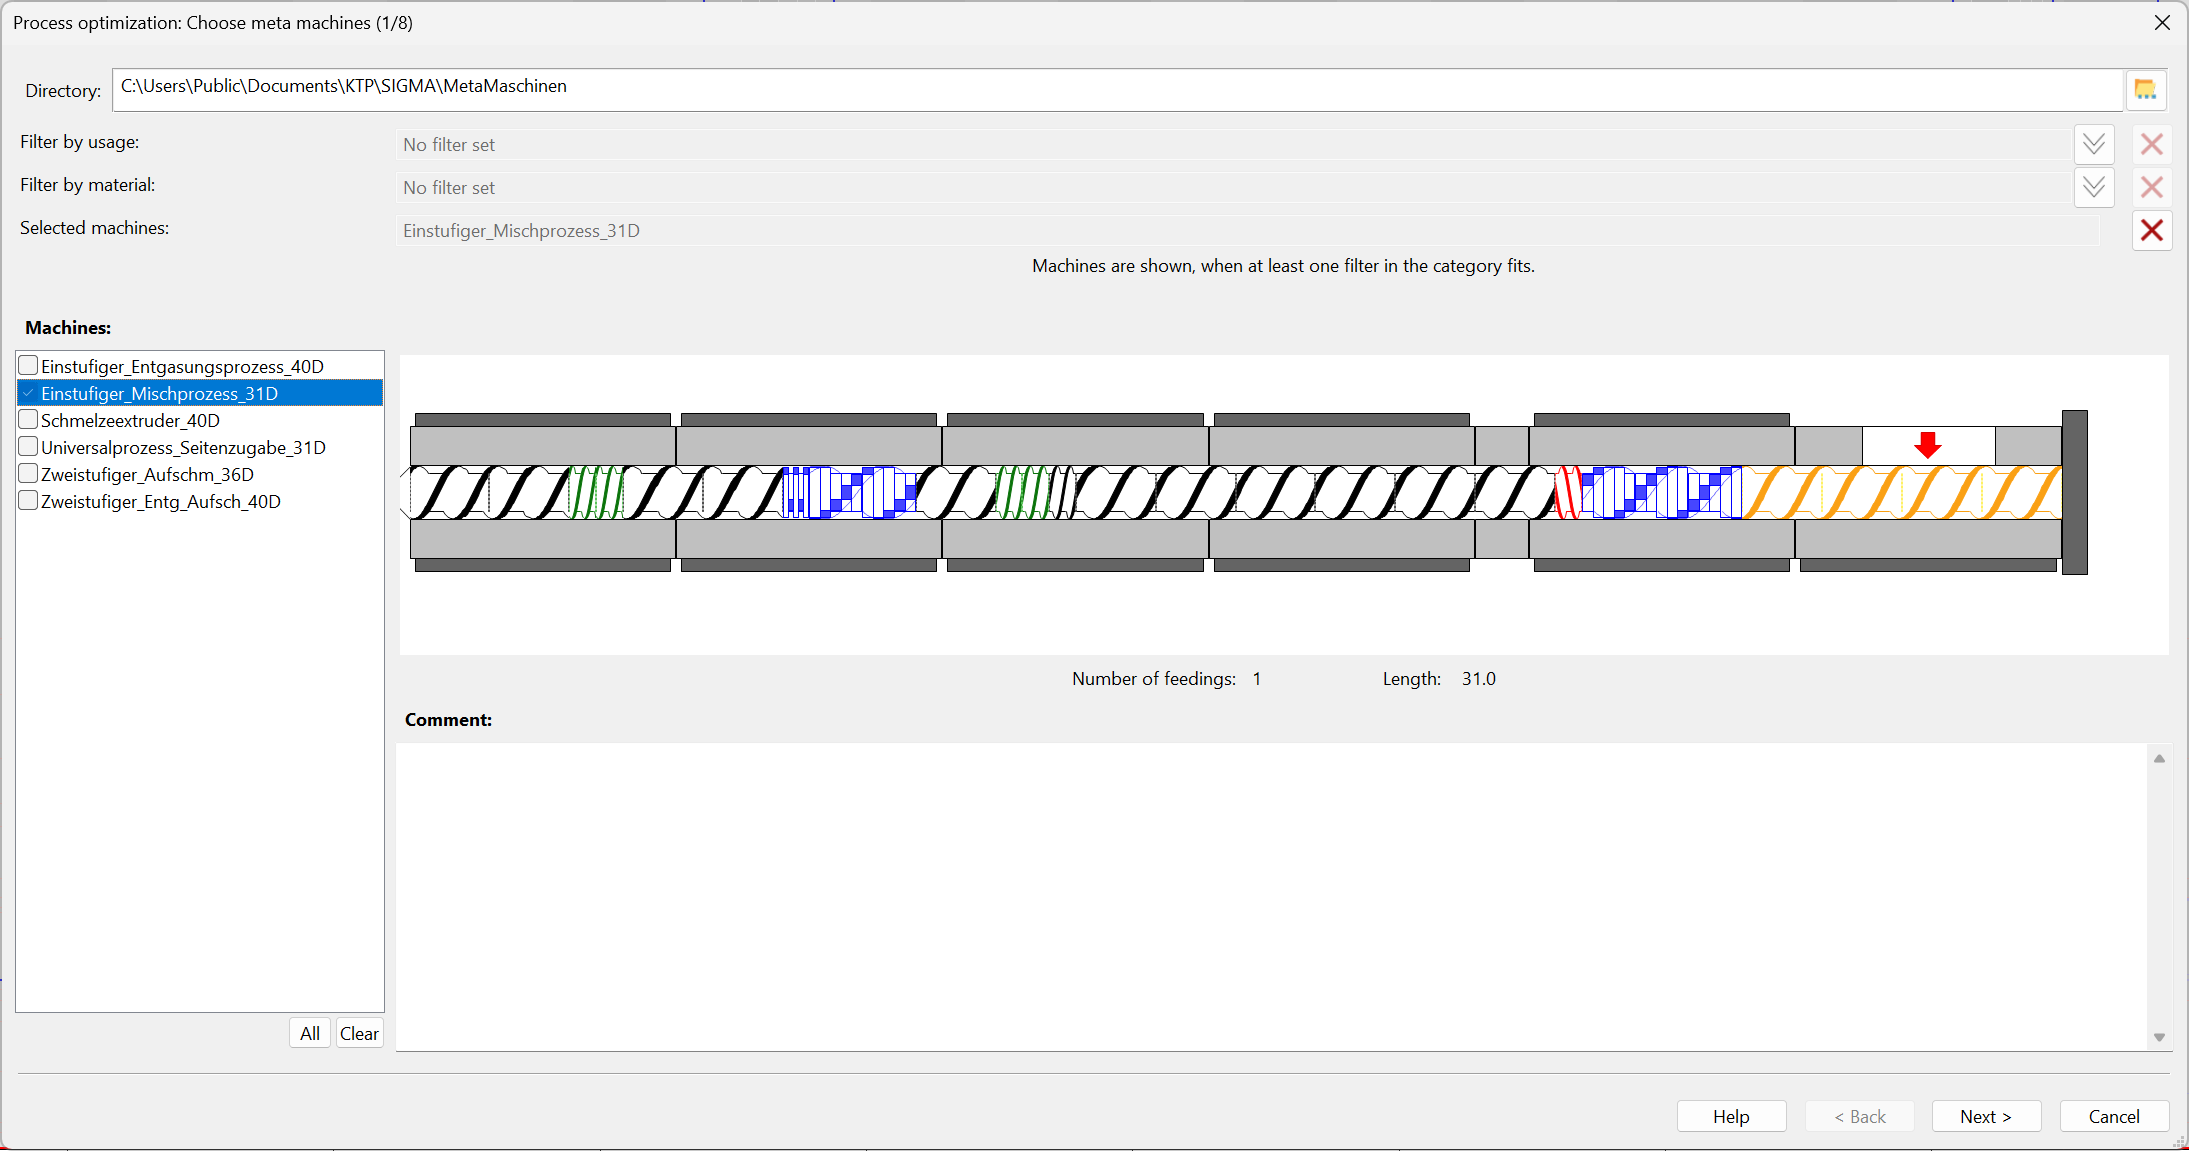
First, one or more diameter-independent meta machines can be selected. A meta machine defines the general screw and barrel layout including feeding positions (e.g. single-stage, two-stage, devolatilization, side feeding, etc.) and serves as a geometry-based framework for the subsequent optimization.
Functions
In the upper part of the dialog, the Directory field is used to select the folder from which meta machines are loaded.
Filters are available to narrow down the list of meta machines:
- Filter by usage
- Filter by material
Info: Machines are shown when at least one filter in the category fits.
Machine list (left)
On the left, the Machines list shows all available meta machines. Entries can be selected for optimization.
Buttons:
- All – selects all entries
- Clear – clears the current selection
Preview and meta machine information
On the right, a graphical preview of the selected meta machine is displayed (screw configuration / barrel representation). Below the preview, key data is shown:
- Number of feedings (number of feeding locations)
- Length (shown as L/D)
In addition, a Comment field is displayed below the meta machine preview where further meta machine information can be read.
Choose machine configuration and die
In this step you define:
- which machine configuration / modular system (*.mbk) is used to generate and apply the diameter-independent meta machine (screw and barrel configuration)
- which die (default definition or user-defined die at the screw tip) is applied
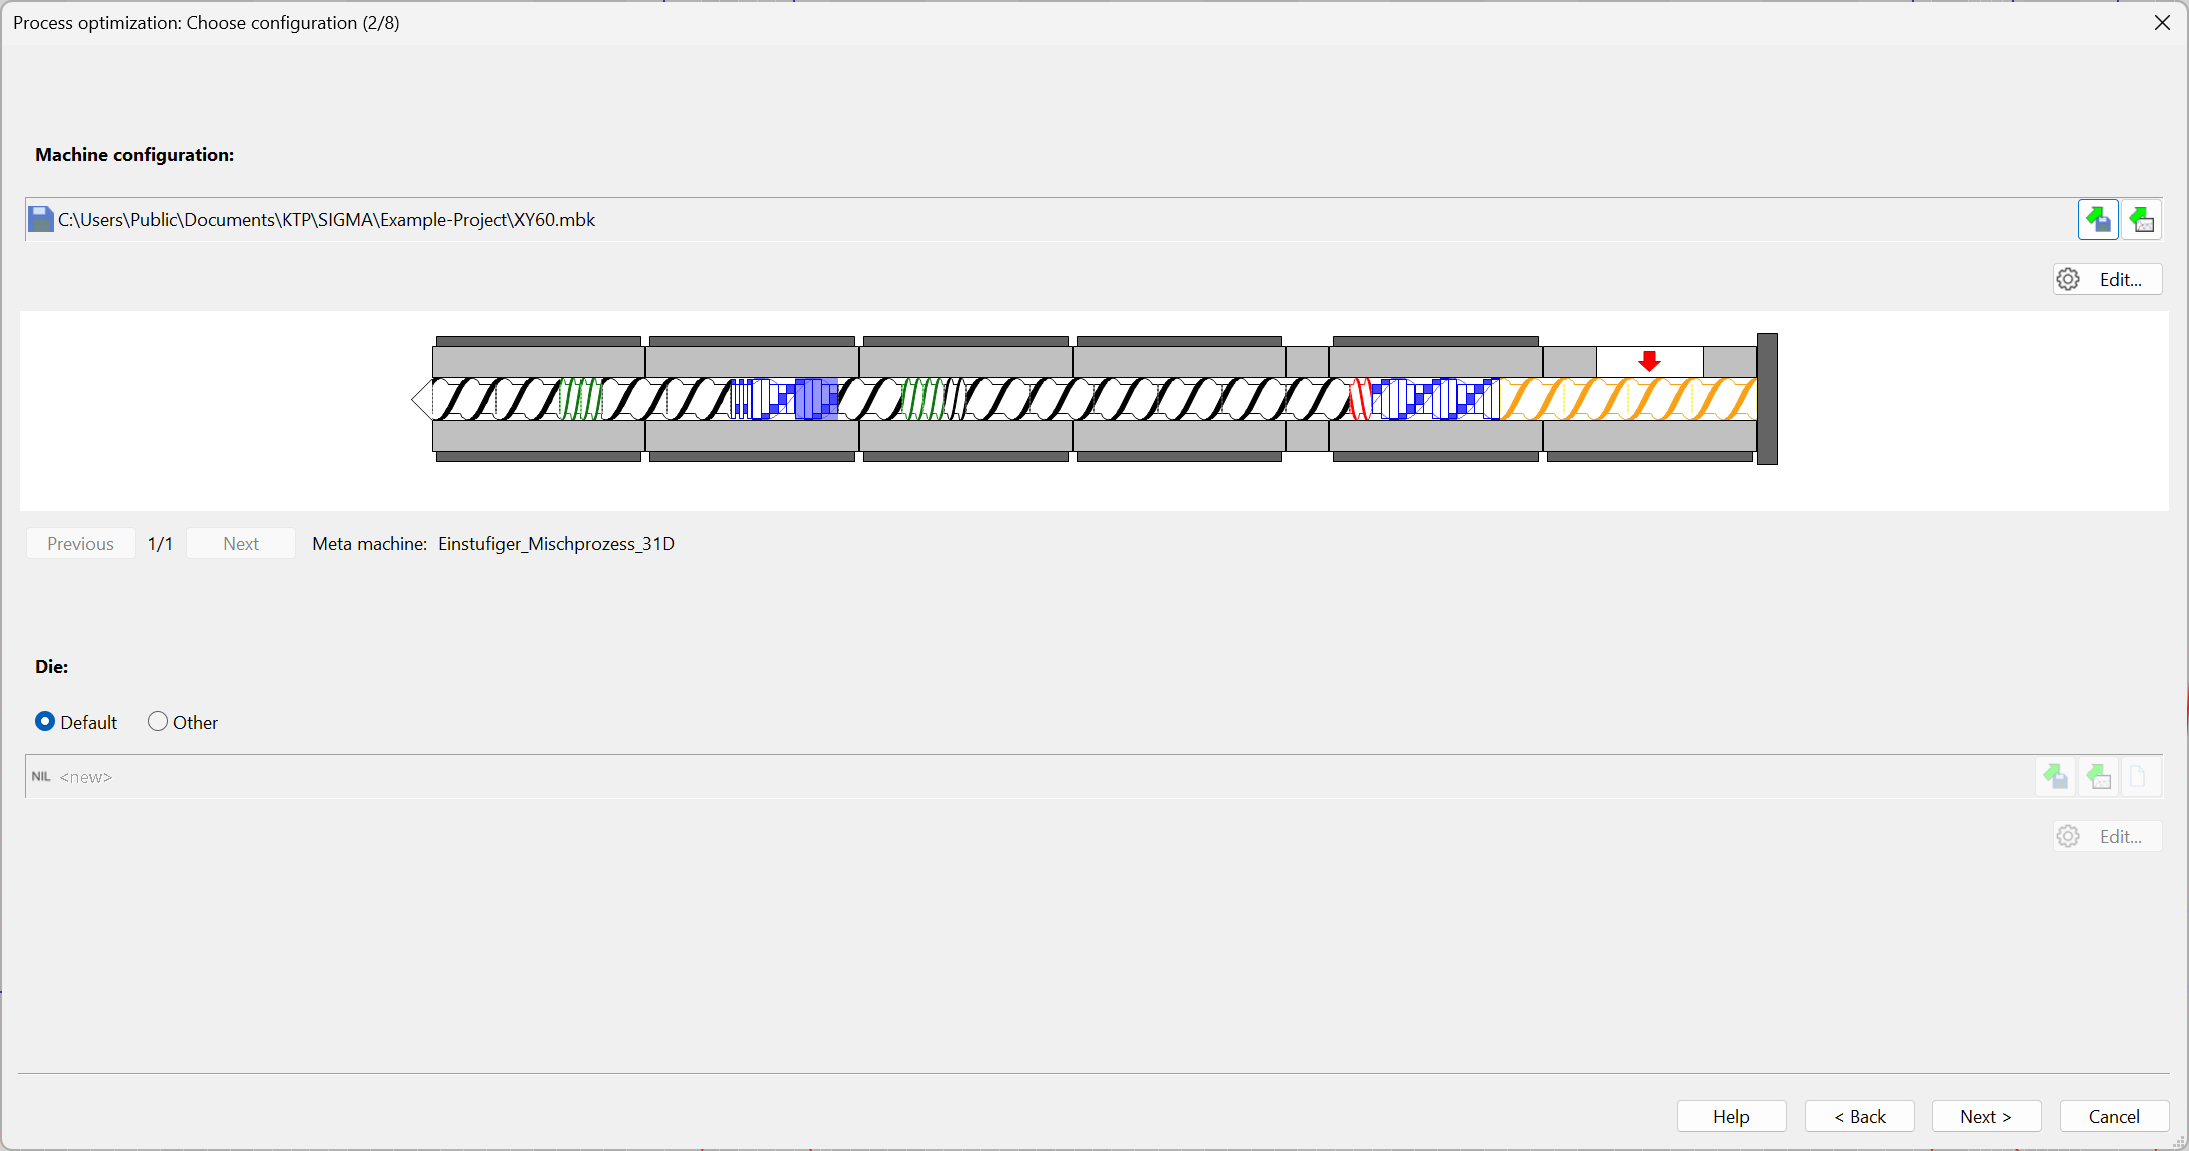
Machine configuration
In the upper area, the machine modular system for the screw and barrel configuration to be optimized must be specified. The selected file is displayed as a path to the *.mbk file.
Available functions:
- Load machine configuration / modular system
- Import configuration from another process
- Edit… – opens the modular system for adjustment (available screw and barrel elements)
A graphical preview of the resulting screw/machine configuration is shown below.
Meta machine navigation
If multiple meta machines were selected, you can switch between them using:
- Previous
- Next
This allows you to verify whether the selected modular system can represent the chosen meta machines.
Die
In the lower area, the die is defined.
Options and functions:
- Default – uses the predefined default die
- Other – allows definition / import of a custom die
- import die from file or another process
- create a new die
- Edit… – open and edit die data
Choose process parameters
In this step, the initial process parameters for each selected meta machine are defined. These parameters form the baseline from which the optimization starts.
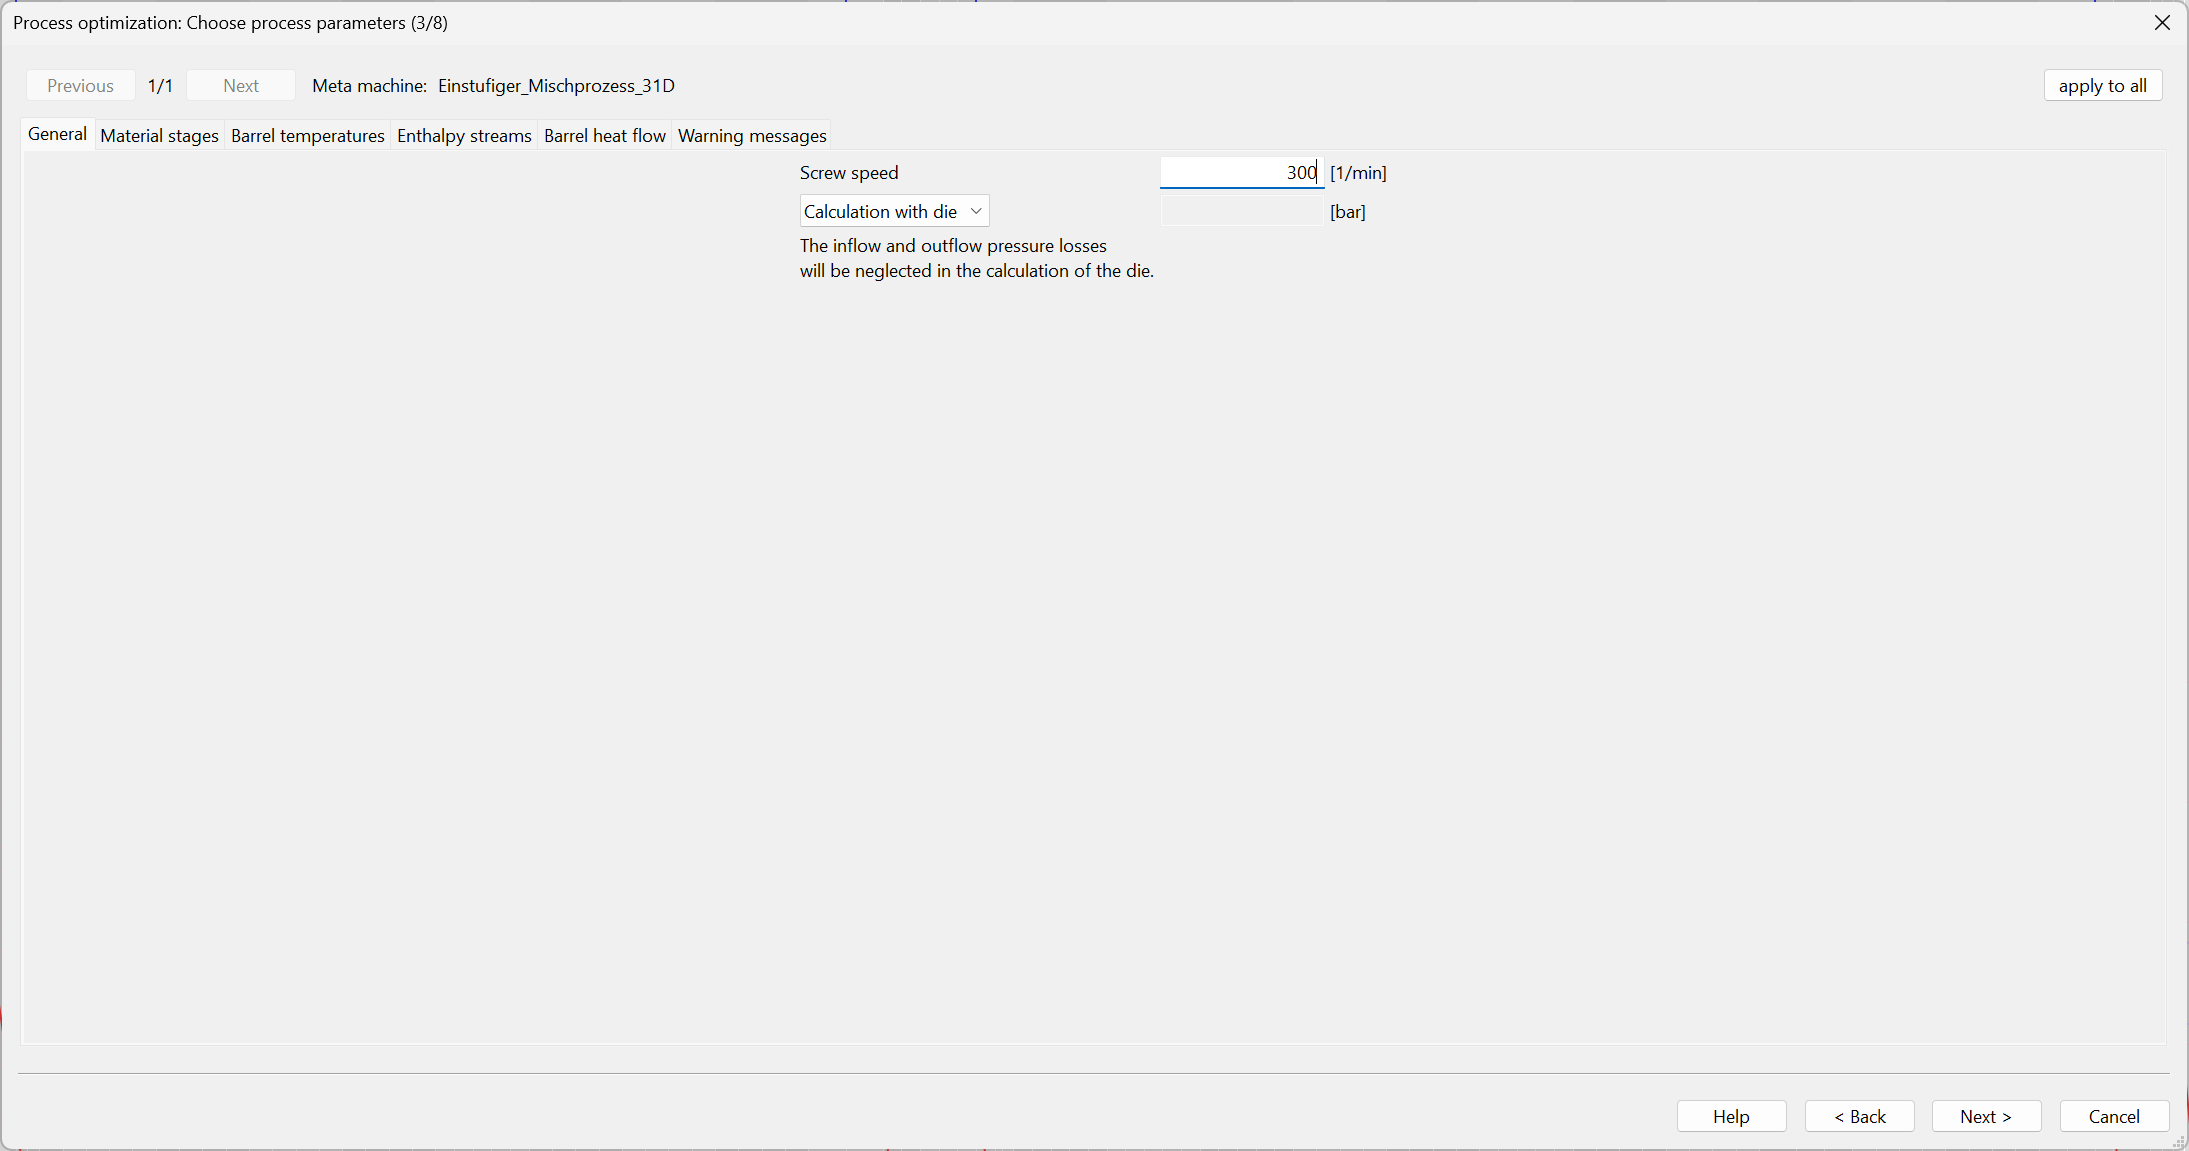
The dialog structure is aligned with the standard process parameter workflow.
Key functions:
- Navigation between meta machines (Previous / Next)
- Display of the active Meta machine
- Button apply to all (transfers the current settings to all selected meta machines / parameter sets)
This enables structured definition of the process parameters.
Process calculation settings
In this step you define which model calculations are executed within a single SIGMA simulation and under which terminating conditions iterative sub-calculations are stopped.
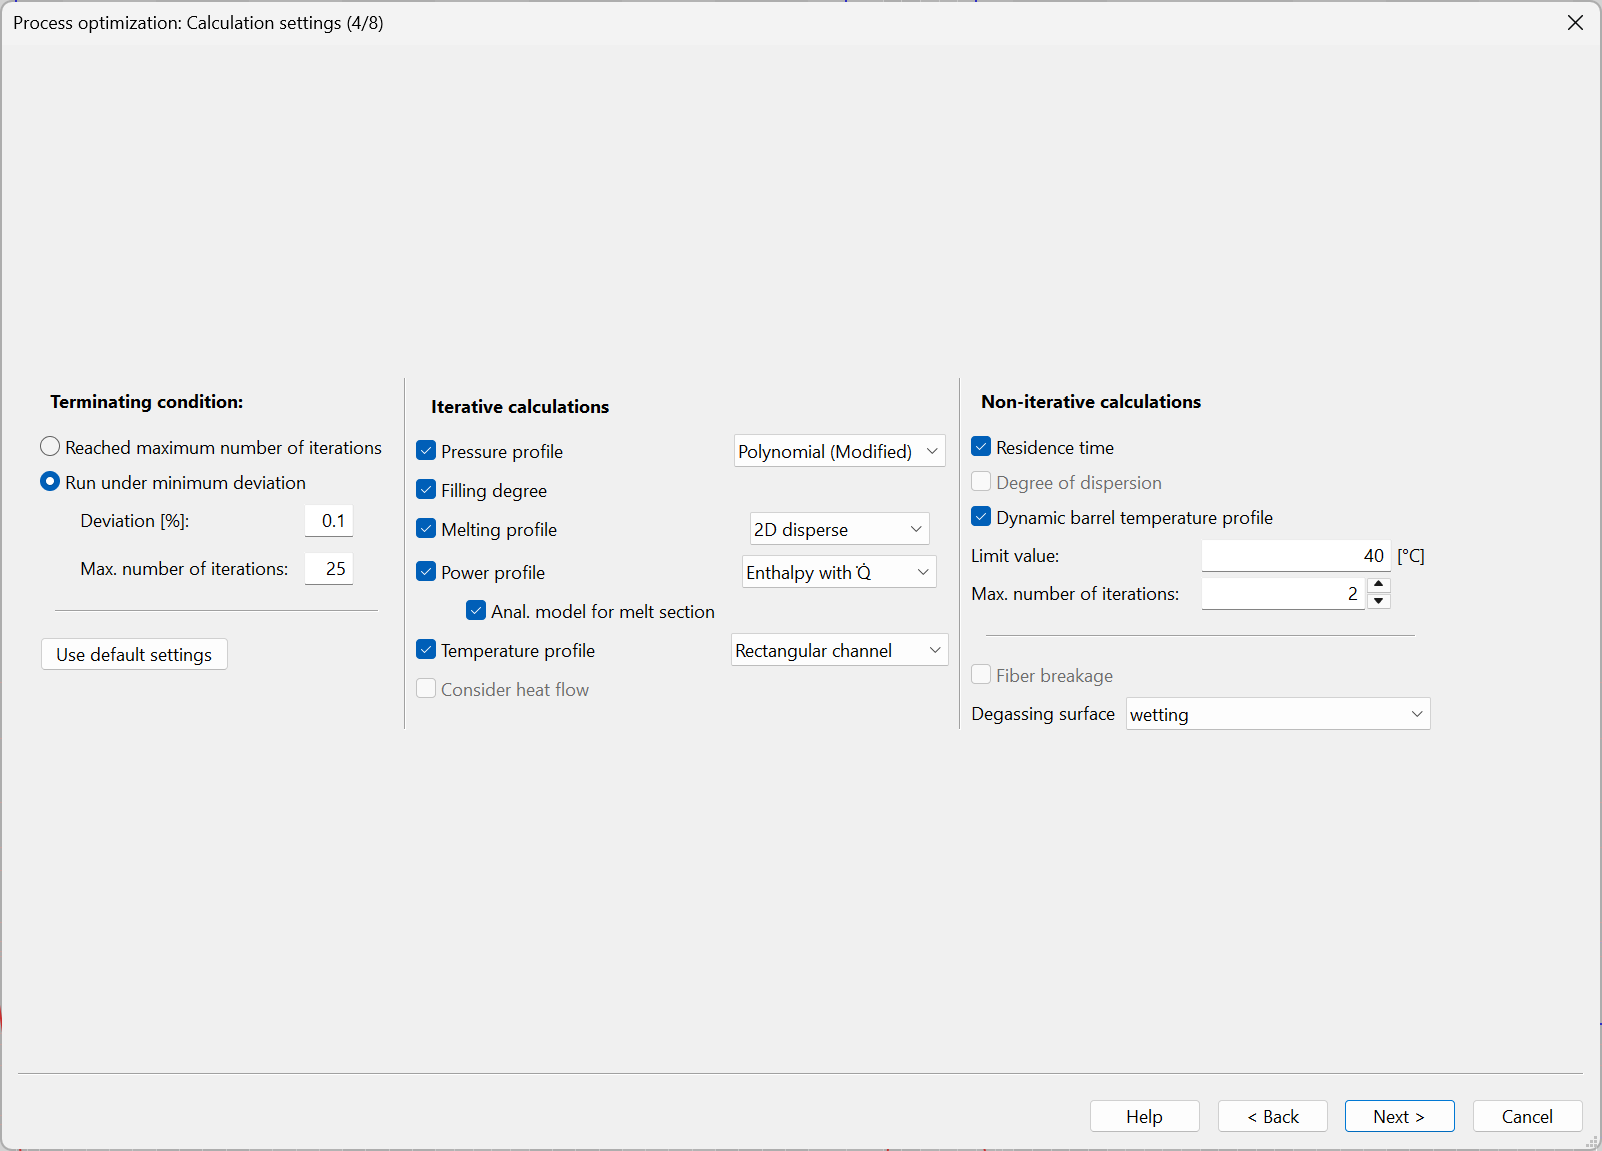
Further information on calculation settings is available here.
Define targets
In this step, the optimization targets are defined. For the given task, process variables, limits, target values, evaluation methods, and weights are specified.
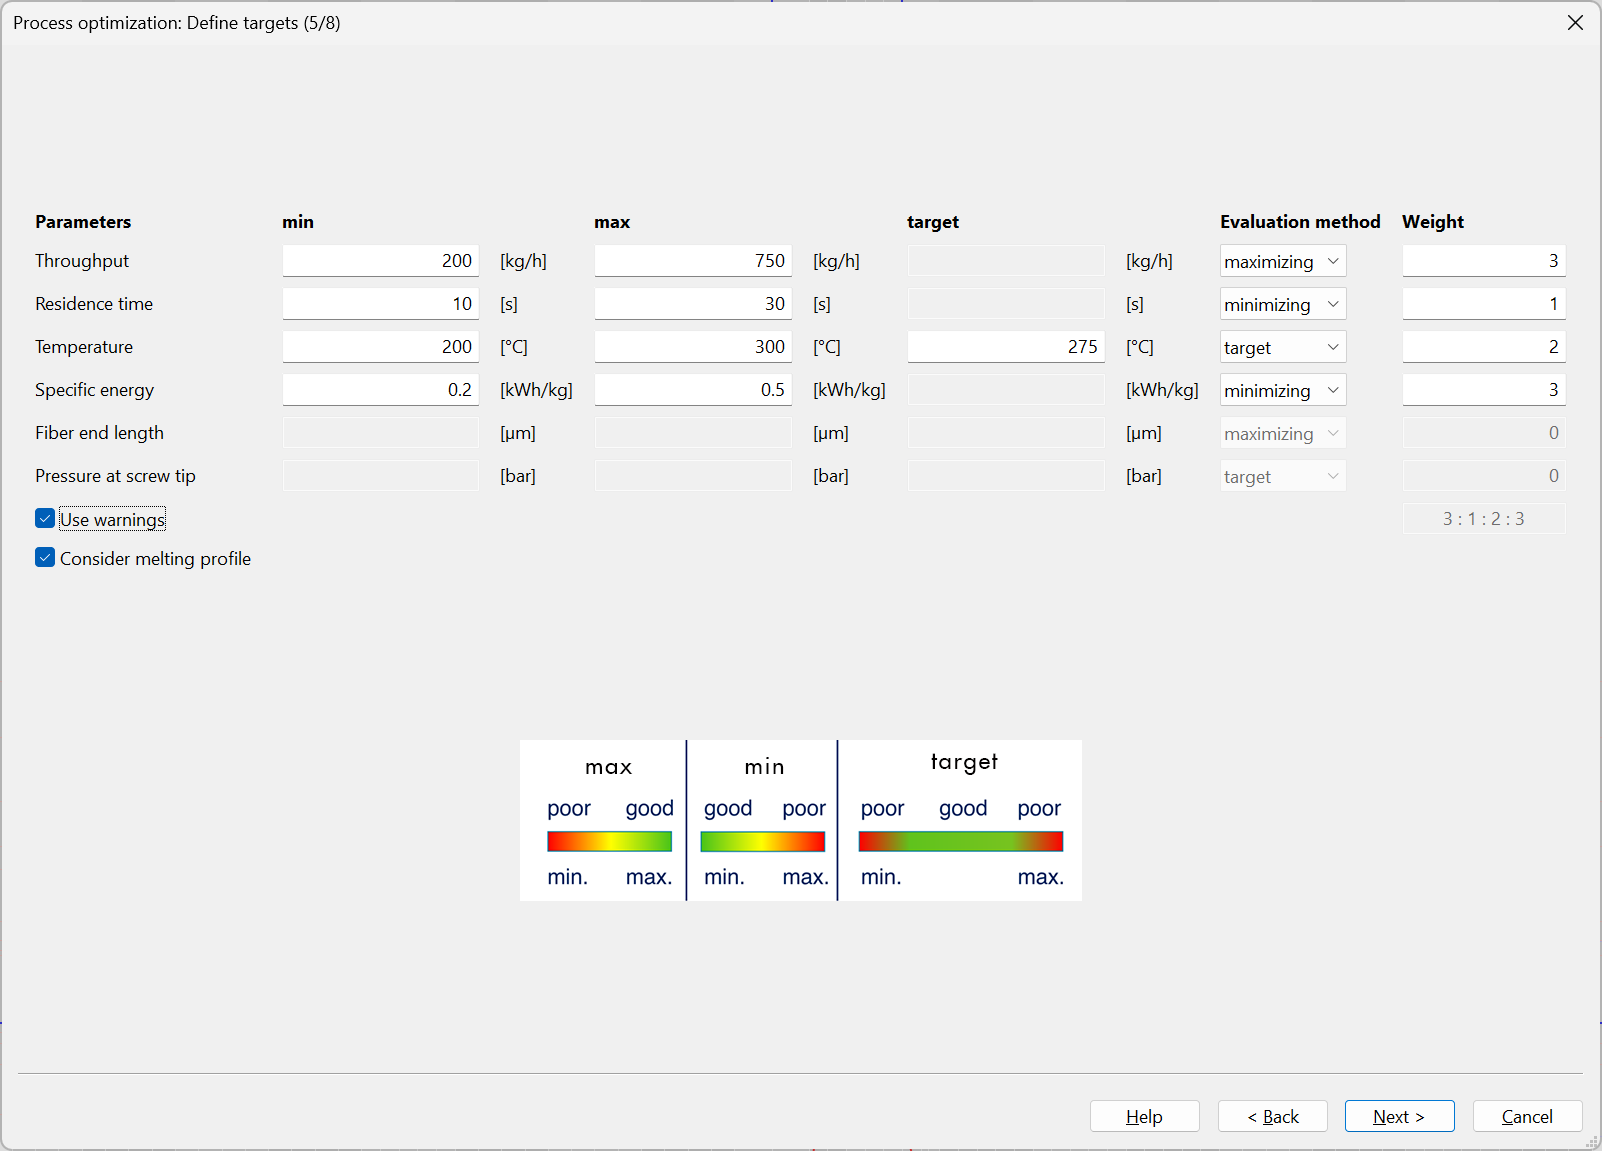
The overview includes the following columns for all target parameters:
- Parameters (target variables)
- min
- max
- target
- Evaluation method
- Weight
Target variables
- Throughput
- Residence time
- Temperature
- Specific energy
- Fiber end length
- Pressure at screw tip
Evaluation methods
In the Evaluation method column, different evaluation logics can be selected for each target variable:
- maximizing (increasing evaluation; the „max“ value is the optimization target)
- minimizing (decreasing evaluation; the „min“ value is the optimization target)
- target (the value defined under „target“ is the optimization target)
The first priority of the optimization is to find processes within the specified limits. Only afterwards does the algorithm attempt to reach the target values.
Weighting
The Weight defines how strongly a parameter contributes to the overall rating.
- high weight: strong influence on the overall optimization rating
- low weight: minor influence
- weight = 0: the parameter is not considered
Additional evaluation options
- Use warnings
- Consider melting profile
These options allow warning conditions and melting behavior to be included in the evaluation of the results.
Optimization settings – PSO strategy
In this step, the parameters of PSO (Particle Swarm Optimization / swarm intelligence) are configured.
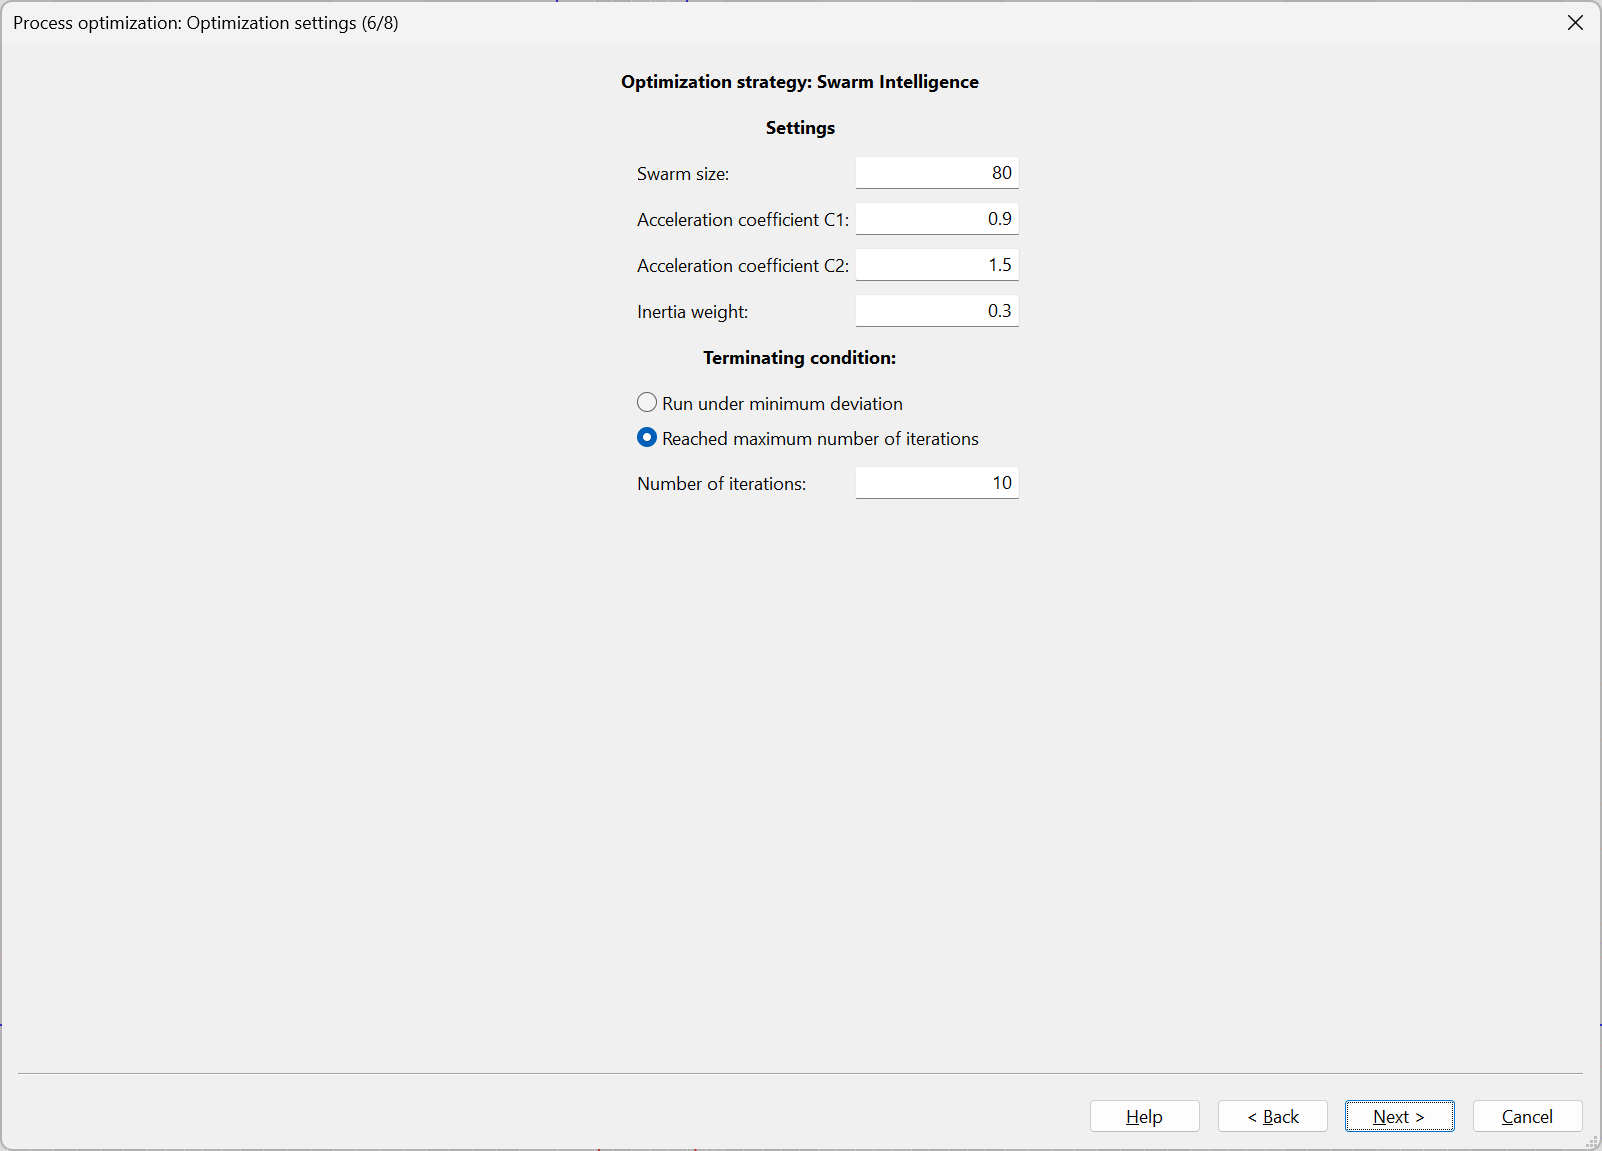
PSO parameters
- Swarm size: Number of particles (solution candidates) evaluated per iteration (larger swarm size = broader search in parameter space, higher runtime per iteration)
- Acceleration coefficient C1: Weighting of the particle movement toward its local best (best solution found by the particle itself).
- Acceleration coefficient C2: Weighting of the particle movement toward the global best (best solution found by the entire swarm).
- Inertia weight: Weighting of the velocity component from the previous iteration.
General swarm effects:
- higher inertia weight → stronger preservation of direction (more exploration)
- lower inertia weight → stronger focusing / smoother convergence (more exploitation)
Optimization terminating condition
You can choose between:
- Run under minimum deviation
- Reached maximum number of iterations
- Number of iterations
Recommendation
The default parameter values are suitable for most use cases and are recommended. They can be adjusted if required, e.g. for:
- larger search spaces
- faster coarse optimization runs
- more robust convergence for complex target definitions
Calculation / Swarm optimization
In this step, the actual optimization is executed using the settings defined previously.
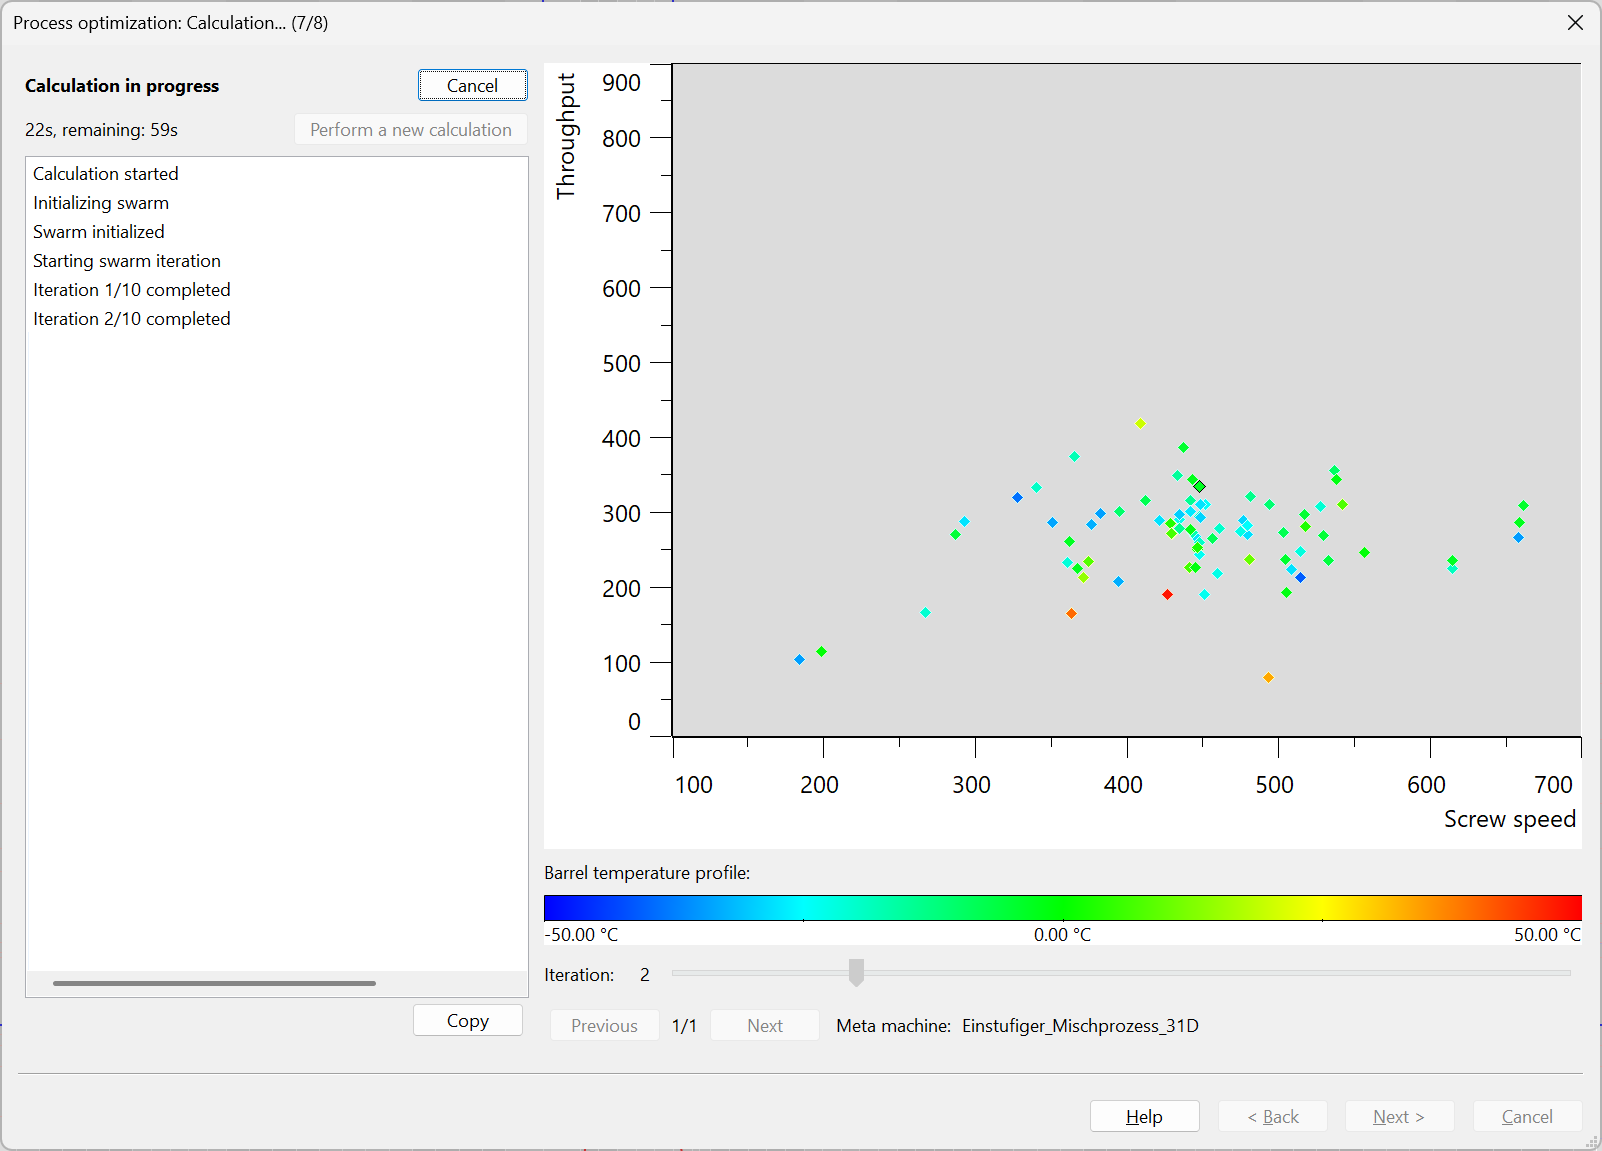
Status and log
Status
The current calculation state is shown in the upper left area:
- Calculation in progress
- remaining time / progress estimate
Buttons
- Cancel – stops the running optimization
- Perform a new calculation – recalculates the swarm after optimization inputs have been modified (availability depends on status)
- Copy – copies the log output to the clipboard
Log window
The log area lists the calculation steps, e.g.:
- Calculation started
- Initializing swarm
- Swarm initialized
- Starting swarm iteration
Particle visualization
In the search-space diagram, particles (individual process candidates) are visualized.
- x-axis: Screw speed
- y-axis: Throughput
The particle color is interpreted using the color scale shown below the diagram.
Color scale / barrel temperature profile
Below the diagram, a color scale labeled Barrel temperature profile is displayed (e.g. -50 °C to +50 °C). It visualizes a temperature-related parameter or a profile deviation (barrel temperature profile delta).
Iteration display
Below the plot:
- Iteration (slider / value)
This allows visualization of individual iteration states.
Select results / Save process
After the optimization is completed, the results (particles / candidate processes) are displayed in a results list.
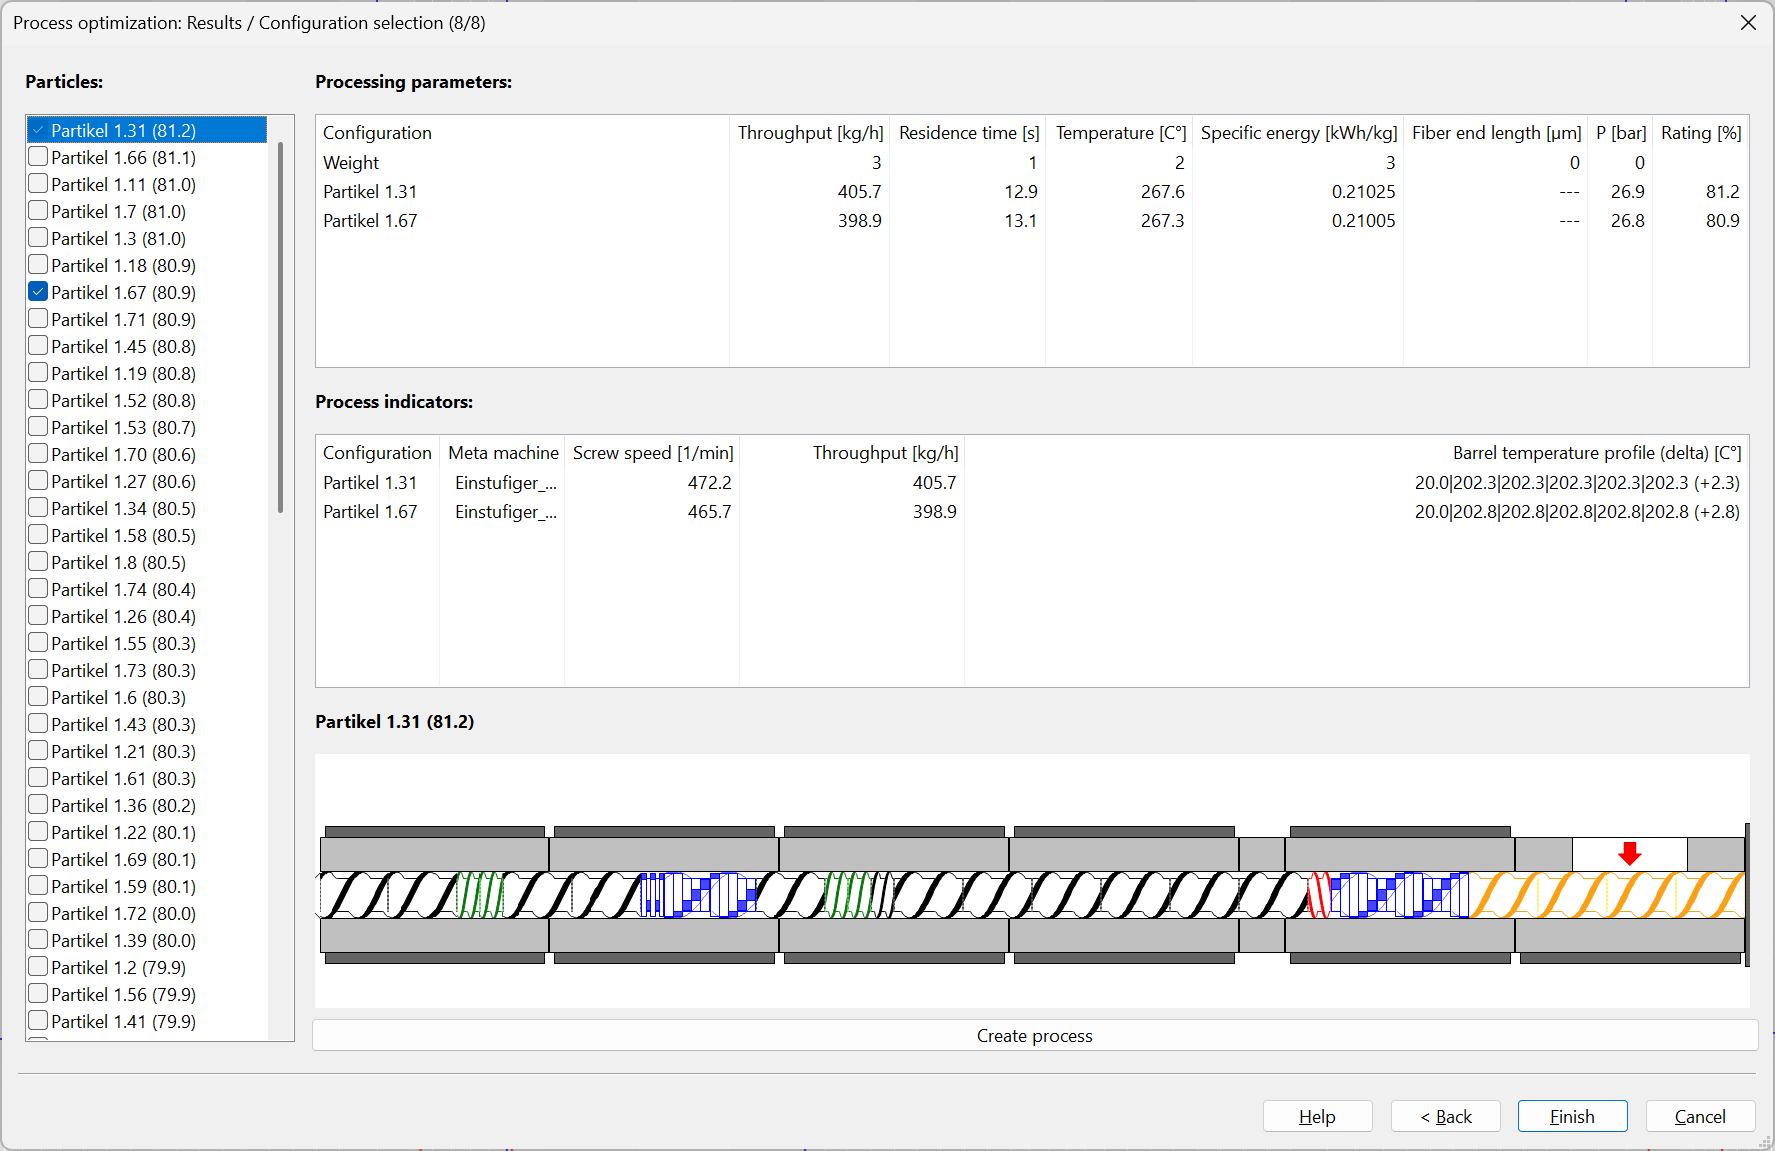
Particle list
Under Particles, all calculated candidate processes are listed, typically with their rating in brackets.
Functions:
- selection of individual particles
- multi-selection for comparison (checkboxes)
- sorting is typically by rating (descending / best candidate on top)
Processing parameters
In the upper right area, the most important result quantities are shown in a table for the selected particles:
- Throughput [kg/h]
- Residence time [s]
- Temperature [°C]
- Specific energy [kWh/kg]
- Fiber end length [µm]
- Pressure at screw tip [bar]
- Rating [%]
Additionally, a Weight row is displayed to document the active evaluation logic.
Process indicators
The middle area provides further configuration-related data per selected candidate:
- Configuration
- Meta machine
- Screw speed [1/min]
- Throughput [kg/h]
- Barrel temperature profile (delta) [°C]
This allows direct comparison between candidates.
Particles (preview): The lower area provides an additional visualization/comparison area for the selected particles.
Create process: This function generates and saves a SIGMA process from the selected optimization candidate. The wizard can then be closed using Finish.
Notes
Choose target definitions carefully
- Do not set limits (min/max) too narrow so that the algorithm has sufficient search space.
- Use target values only where a true setpoint exists (e.g. temperature, pressure).
- Set weights intentionally (e.g. high throughput weight for production optimization; higher temperature/residence-time weight for material-sensitive processing).
PSO parameters
- Start with the default values.
- A larger swarm size increases the chance of finding good solutions but increases runtime.
- More iterations often improve convergence, especially for complex objective functions.
Result evaluation
- Do not focus only on the highest rating; also verify process robustness.
- Compare several particles (e.g. similar rating but different screw speed / barrel temperature profiles).
- Check plausibility of indicators and warnings before final process creation/saving.