Dies ist eine alte Version des Dokuments!
Diagrams
Diagrams
The menu item Diagram contains all diagrams for the visualization of calculation results and of the machine configuration. In the following all available diagrams are itemized: The menu item Diagram contains all diagrams for the visualization of calculation results and of the machine configuration. In the
- Pressure and filling degree profile
- Temperature profile
- Power consumption
- Residence time distribution
- Degree of dispersion
- Melting profile
- Heat flows
- Shear rate and pressure in the tool
- and any user-defined diagram
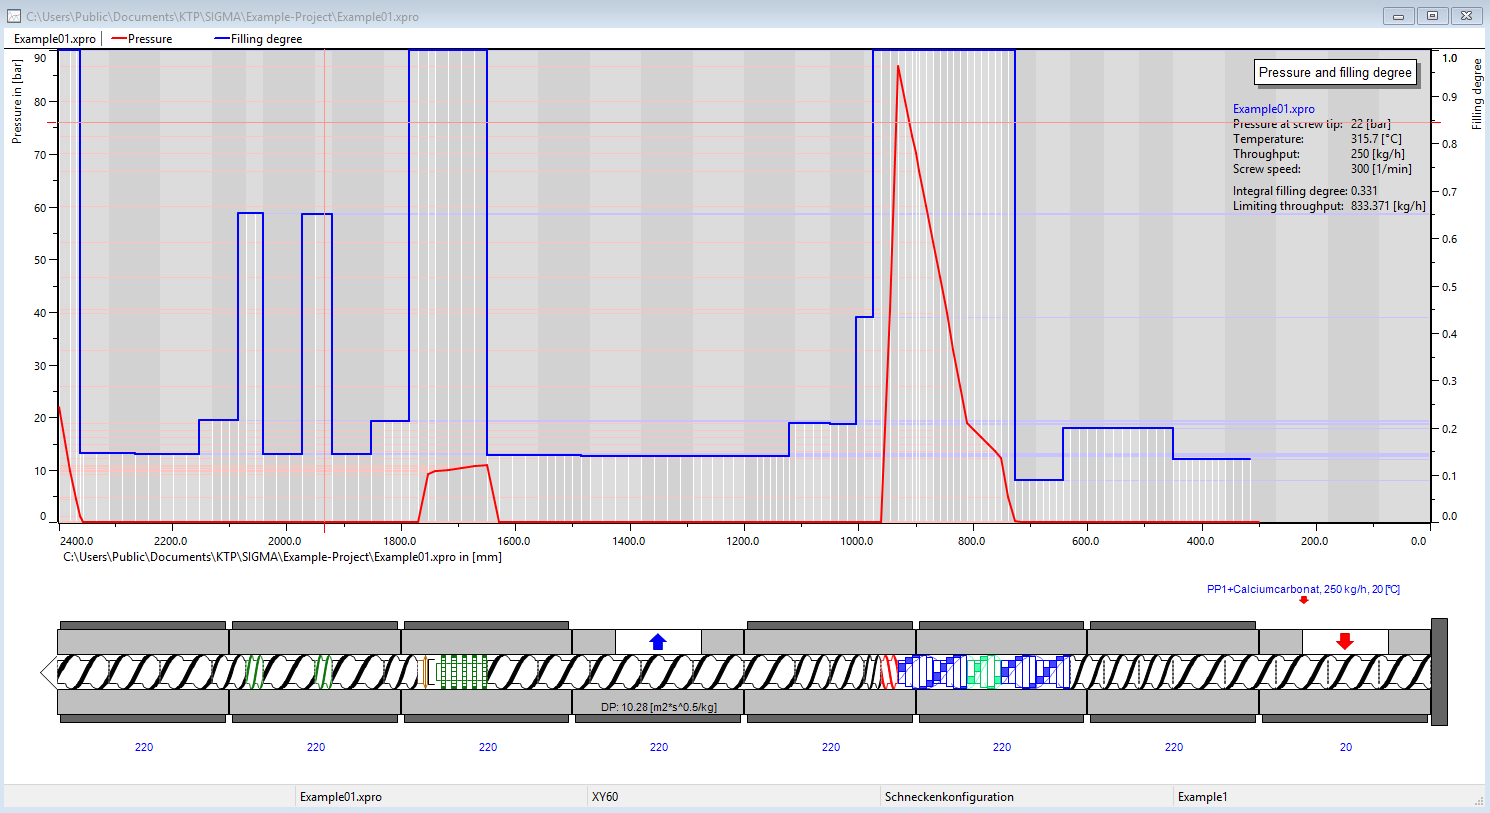 Figure: Graphic depiction of pressure and filling degree
Every diagram has in the top left respectively right corner (depending on the arrangement of the screw) an outline with all corresponding information. This outline can be shown or hidden on request while clicking on the process name inside the diagram.
In the diagram Pressure and Filling Degree (see figure) the pressure (red curve) and the filling degree (blue curve) resulting from the calculations are shown over the length of the screw. In order to compare different screw sections the screw and barrel configuration are shown underneath the diagram.
The calculated melting profile (see figure) is shown in diagram similar to the one of the pressure and filling degree. The red curve gives the rate of the melt material in the groove section. Moreover, the beginning and the end of the melting (in millimeter) is given on the right side of the diagram.
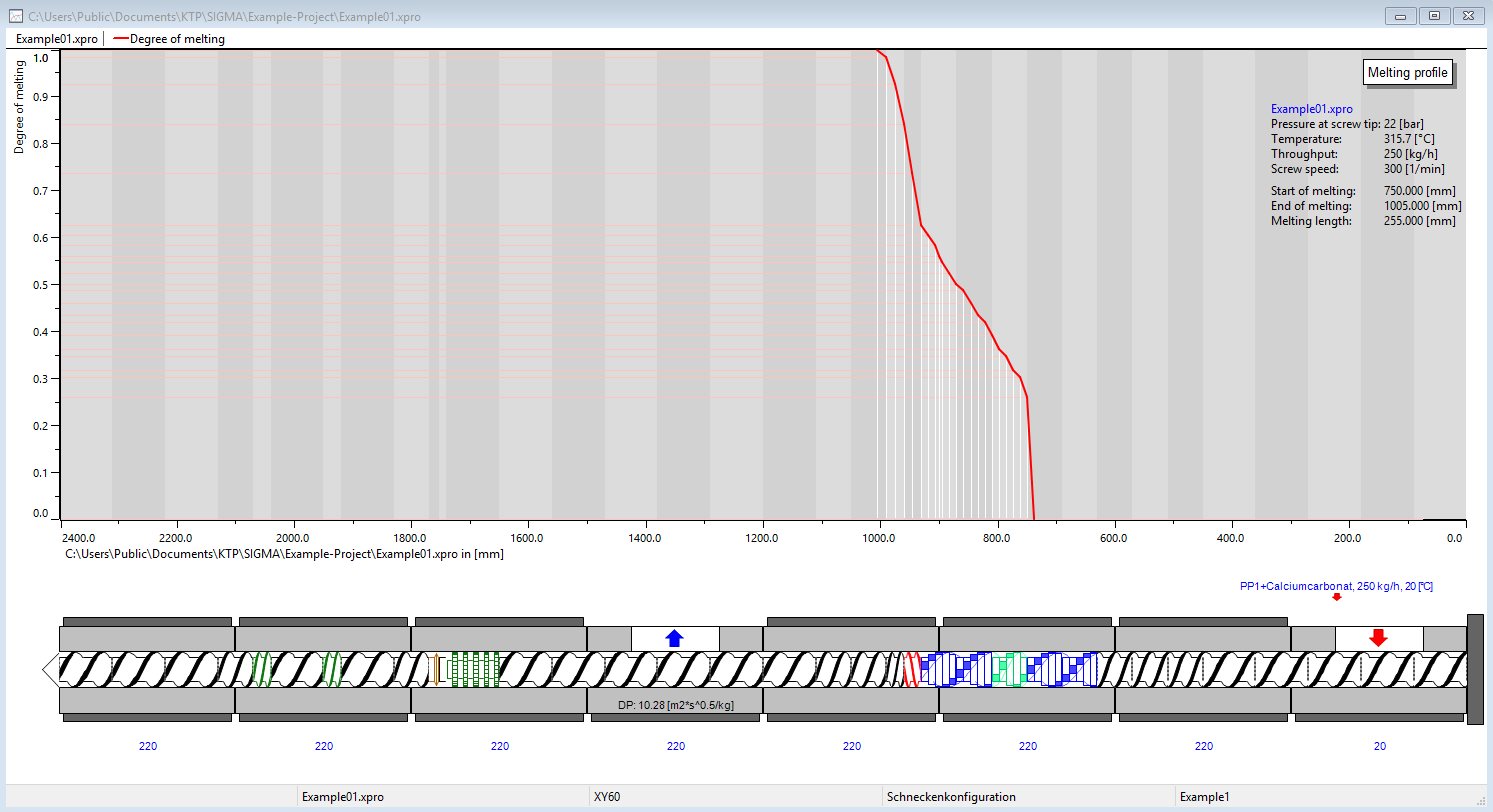 Figure: Graphic depiction of melting profile
Similar diagrams are given for the Temperature profile (see figure), the Power consumption (see figure) and the Residence time distribution (see figure). Due to simplify a comparison, the design of the diagrams is always the same.
**Important: **Subsequent to a change of machine configuration or process parameters the diagrams are updated after a calculation automatically.
In the diagram for the Power consumption (see figure) the calculated results are visualized and numerical values for the calculated power consumption and torque, resulting from the power calculation, are given on the right on top.
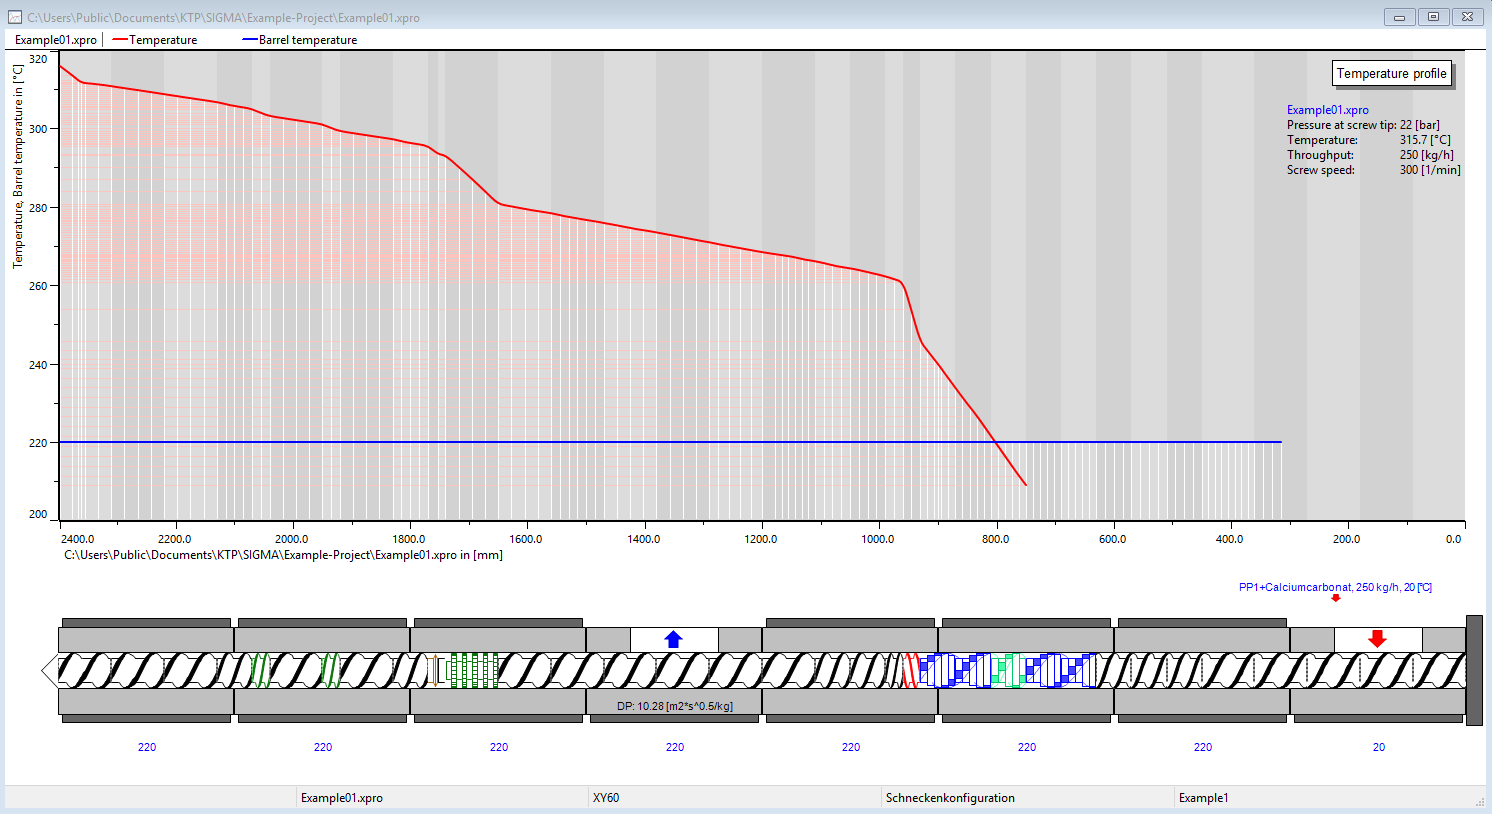 Figure: Graphic depiction of temperature profile
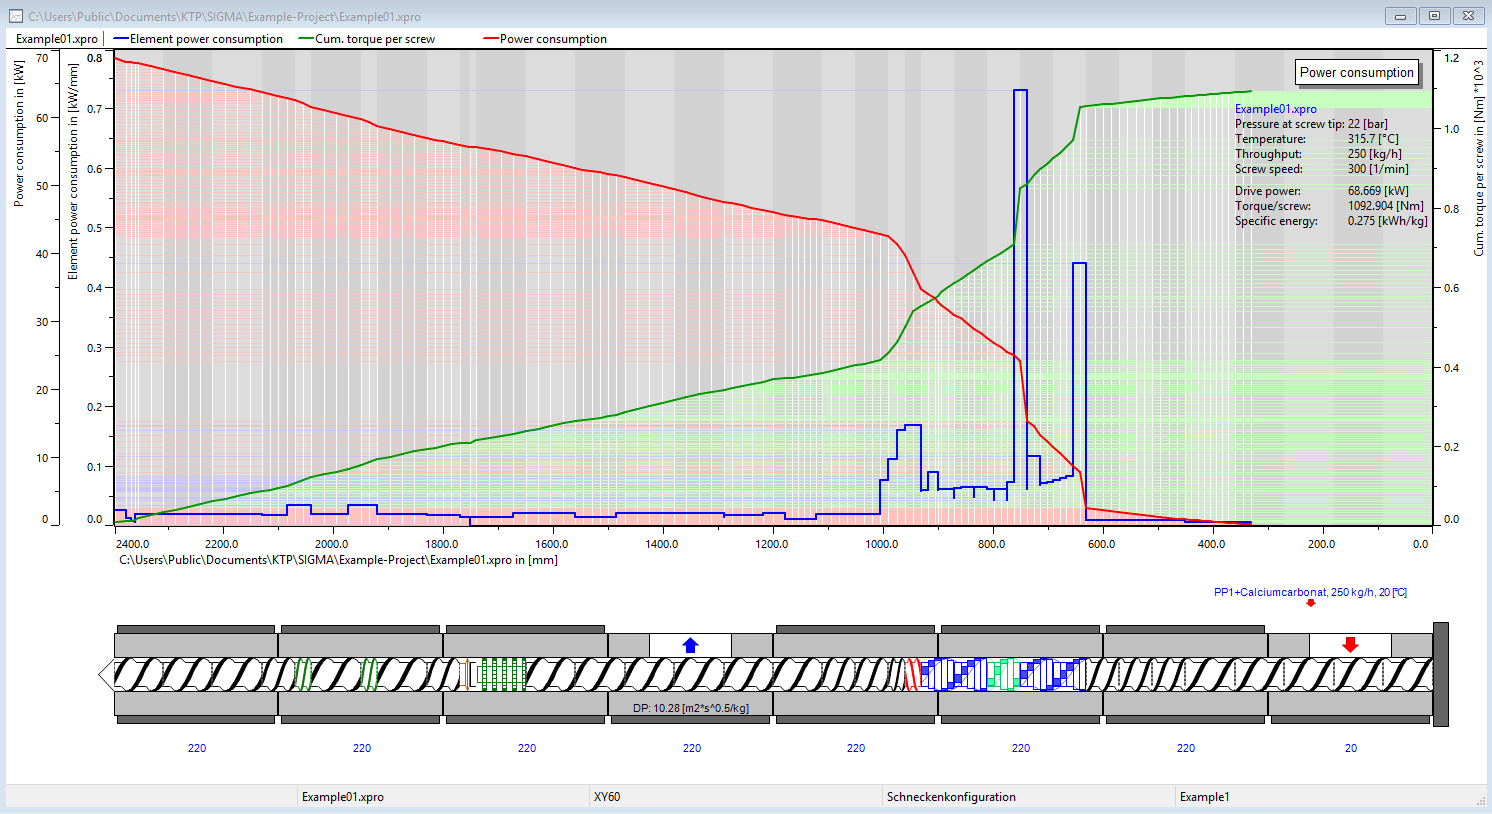 Figure: Graphic depiction of power consumption
Fig. shows the diagram of the Residence time distribution. This diagram visualizes both, the maximal (blue) and the minimal (red) residence time across the screw. Moreover the axial mixing coefficient (green) as measure for the mixing process is given over the sections of equal geometry. The variance of the residence time distribution is an integral value to characterise the longitudinal mixing. The larger the value is the better the longitudinal mixing.
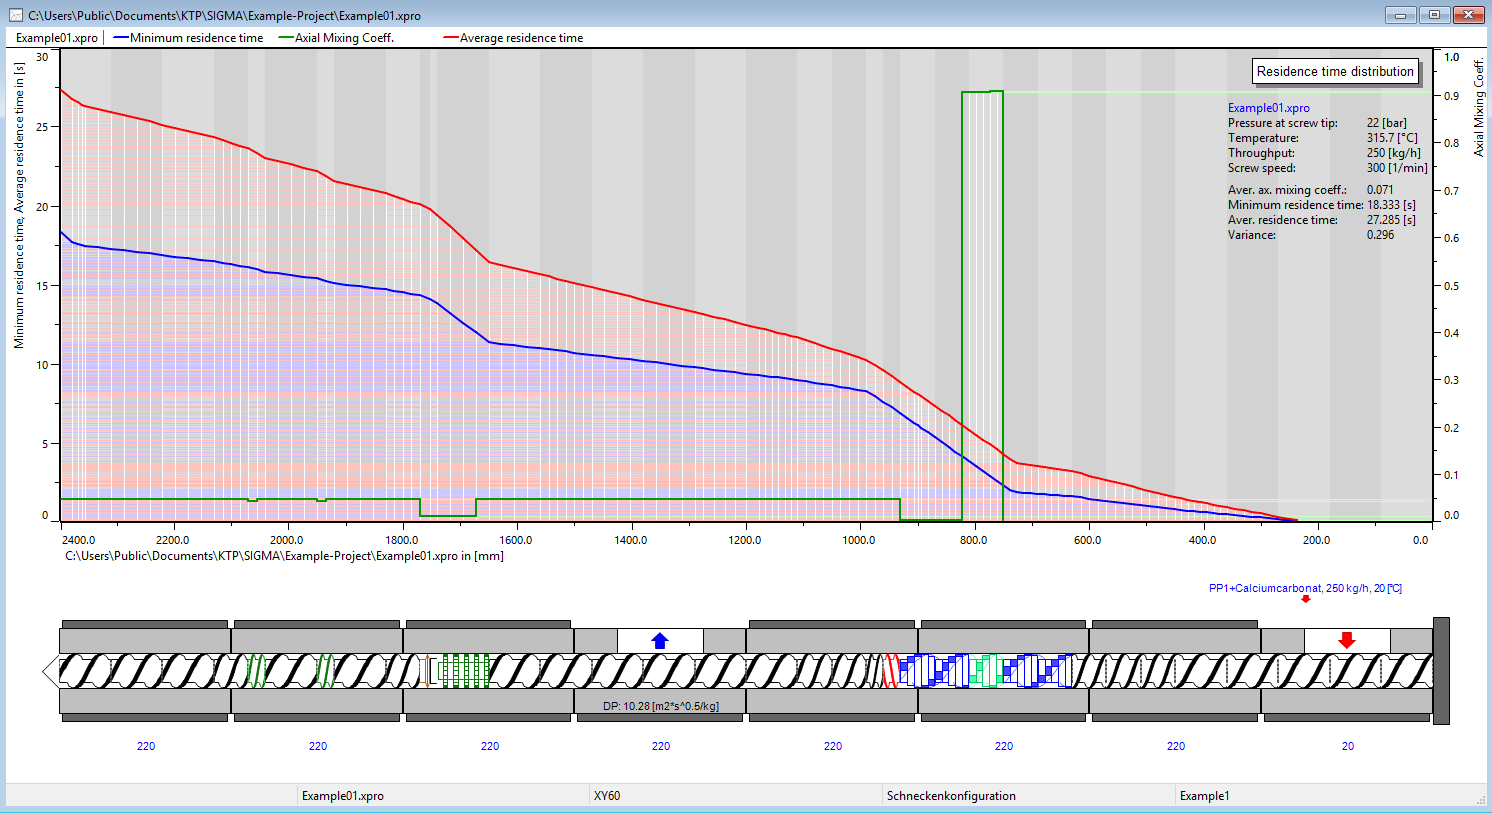 Figure: Graphic depiction of residence time distribution