Dies ist eine alte Version des Dokuments!
Experimental Data Management
Create a New Measuring Data Table - Measuring Manager
Path: Main menu > Experimental data > Measuring Manager…
First of all a new measuring data table has to be created. The Measuring data manager is opened by choosing Experimental data, Manager or by clicking on the corresponding icon in the toolbar.
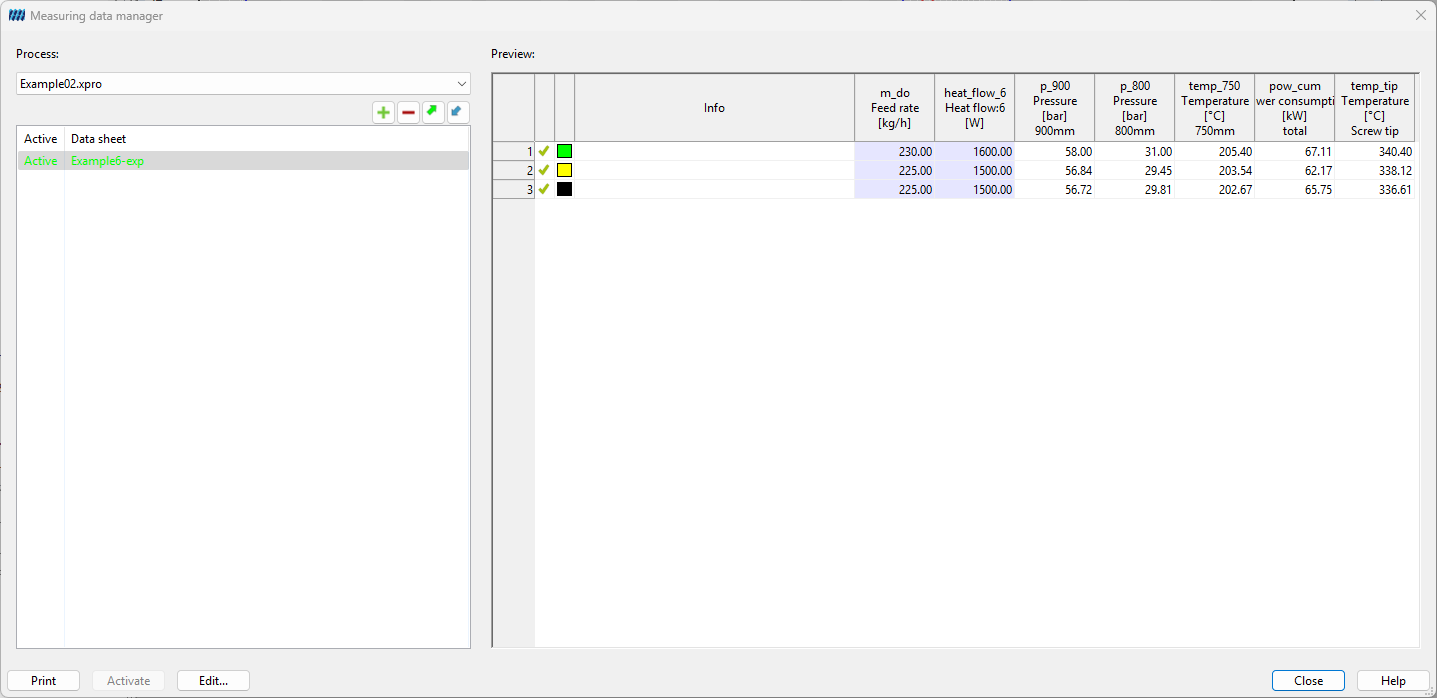
In the opening dialog box Measuring data manager (see figure) it is possible to create, load , edit, print and delete measuring data tables . Furthermore, by means of the measuring data manager test data can be imported from MS Excel . Click the button New ** to open a new **Measuring data table (see).
Edit a Measuring Data Table
Path: Main menu > Experimental data > Current measuring table…
A row in the new measuring data table represents a series of measurement (the experimental results of a measurement) and a column stands for a measuring point of the process.
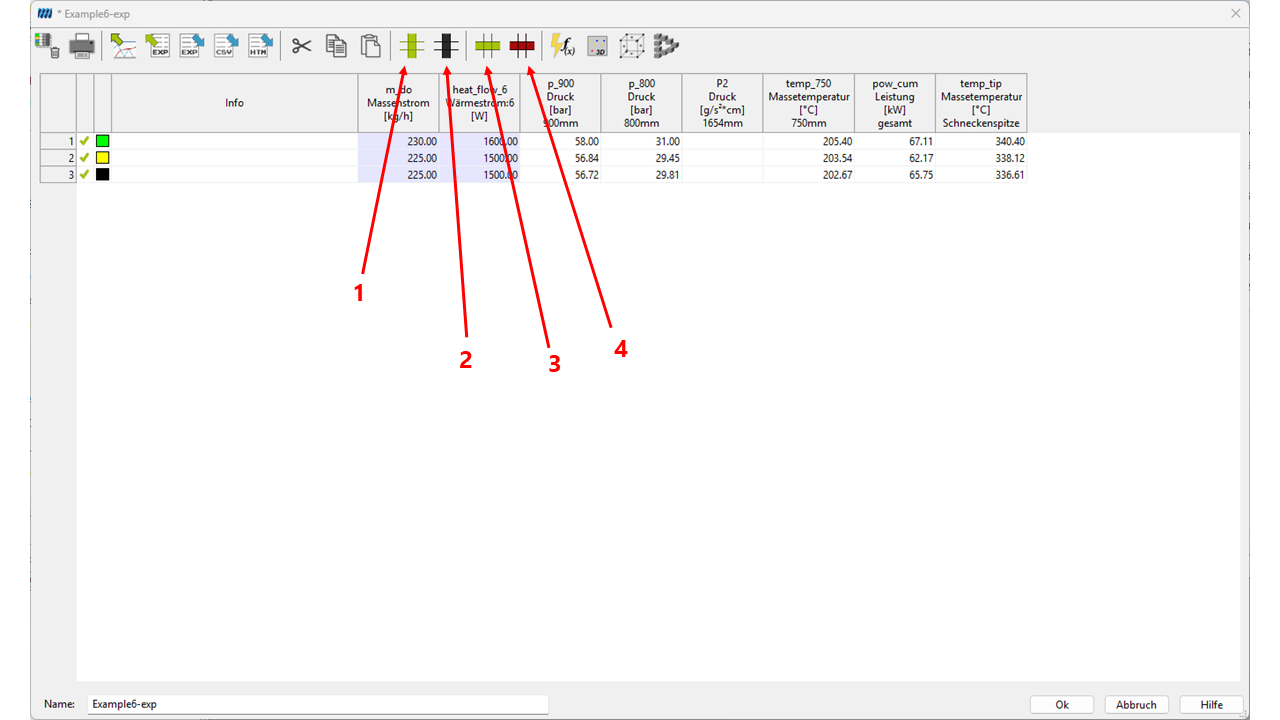
- New Measuring Point
- Delete Measuring Point
- Create New Measurement Series
- Delete Measurement Series
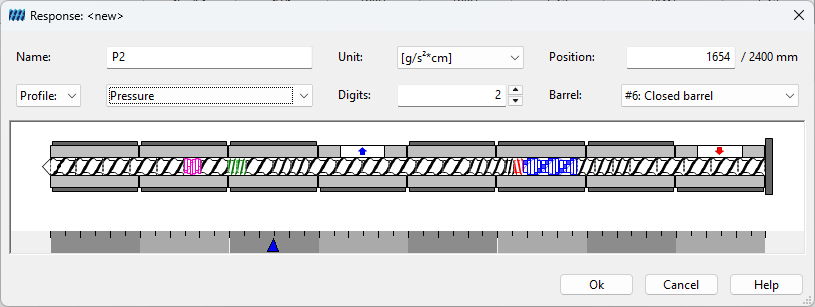
The dialog box Edit measuring point (see Fig.) where to define a new measuring point can be opened by choosing Edit, Insert measuring point or by clicking the respective icon. To define a new measuring point, its Name, Type (there are various possibilities available such as pressure and temperature), Unit, Position and the Precision have to be entered. Click Ok to confirm the entered data.
A new series of measurements is created analogous by choosing Edit,** Insert a series of measurement** or clicking the belonging icon in the toolbar (see figure). By activating the small box next to a series of measurement you choose whether to display the respective series of measurement or not. The color of a series of measurement can be assigned by clicking the corresponding small box to be found next to each series of measurement, too.
Now, the experimental data can be entered into the table directly. The data is saved by choosing File, Save as or clicking the disc symbol icon .
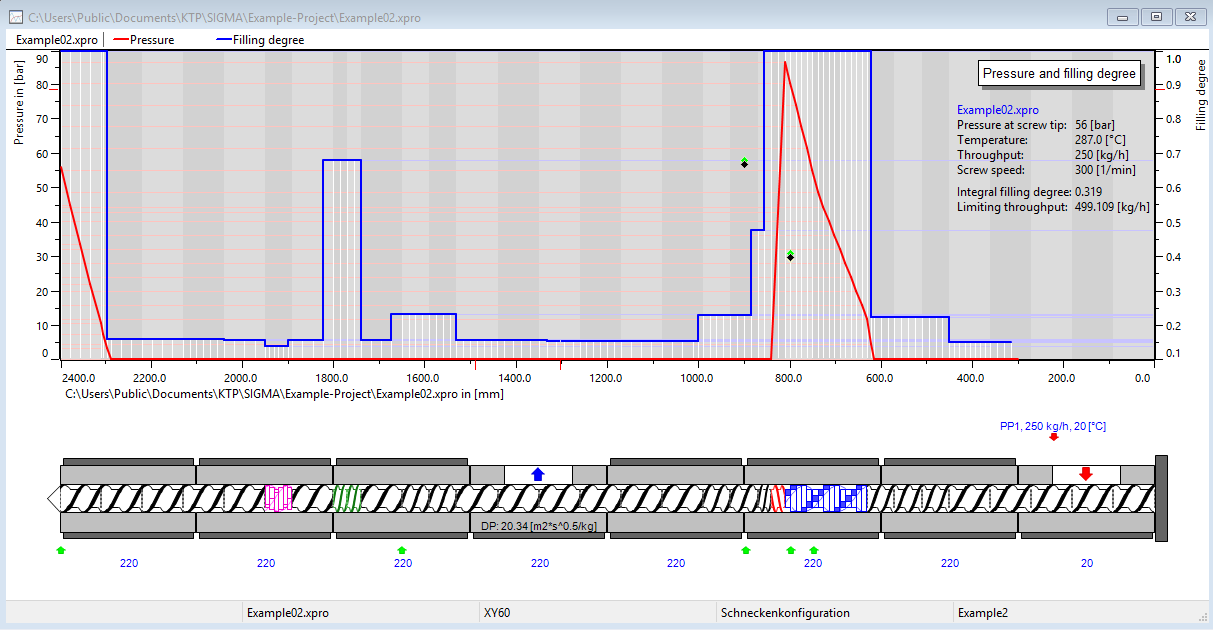
In the diagrams the series of measurements are shown as rhombi in each diagram and measuring points are shown as green arrows below screw and barrel configuration (see figure).